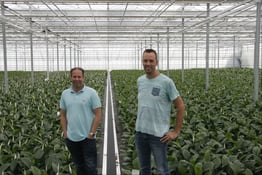
The WPS digital phenotyping system is the most complete and versatile system on the market, giving researchers the unique ability to fully control every parameter in an experiment. The turnkey solution is designed to work alongside and fully document the growth cycle of the plants, using advanced imaging techniques.
We’ve broken down the process to provide a better understanding of the digital plant phenotyping system. The numbers in the picture are explained below.
1. Experimentation Control Software
The WPS Experimentation Control Software gives the user the ability to seamlessly integrate and initiate phenotyping experiments. The software provides flawless control over measurement settings, task scheduling, irrigation and plant information management. Is also provides the basis for data handling, analysis and reporting.
For more information, click here.
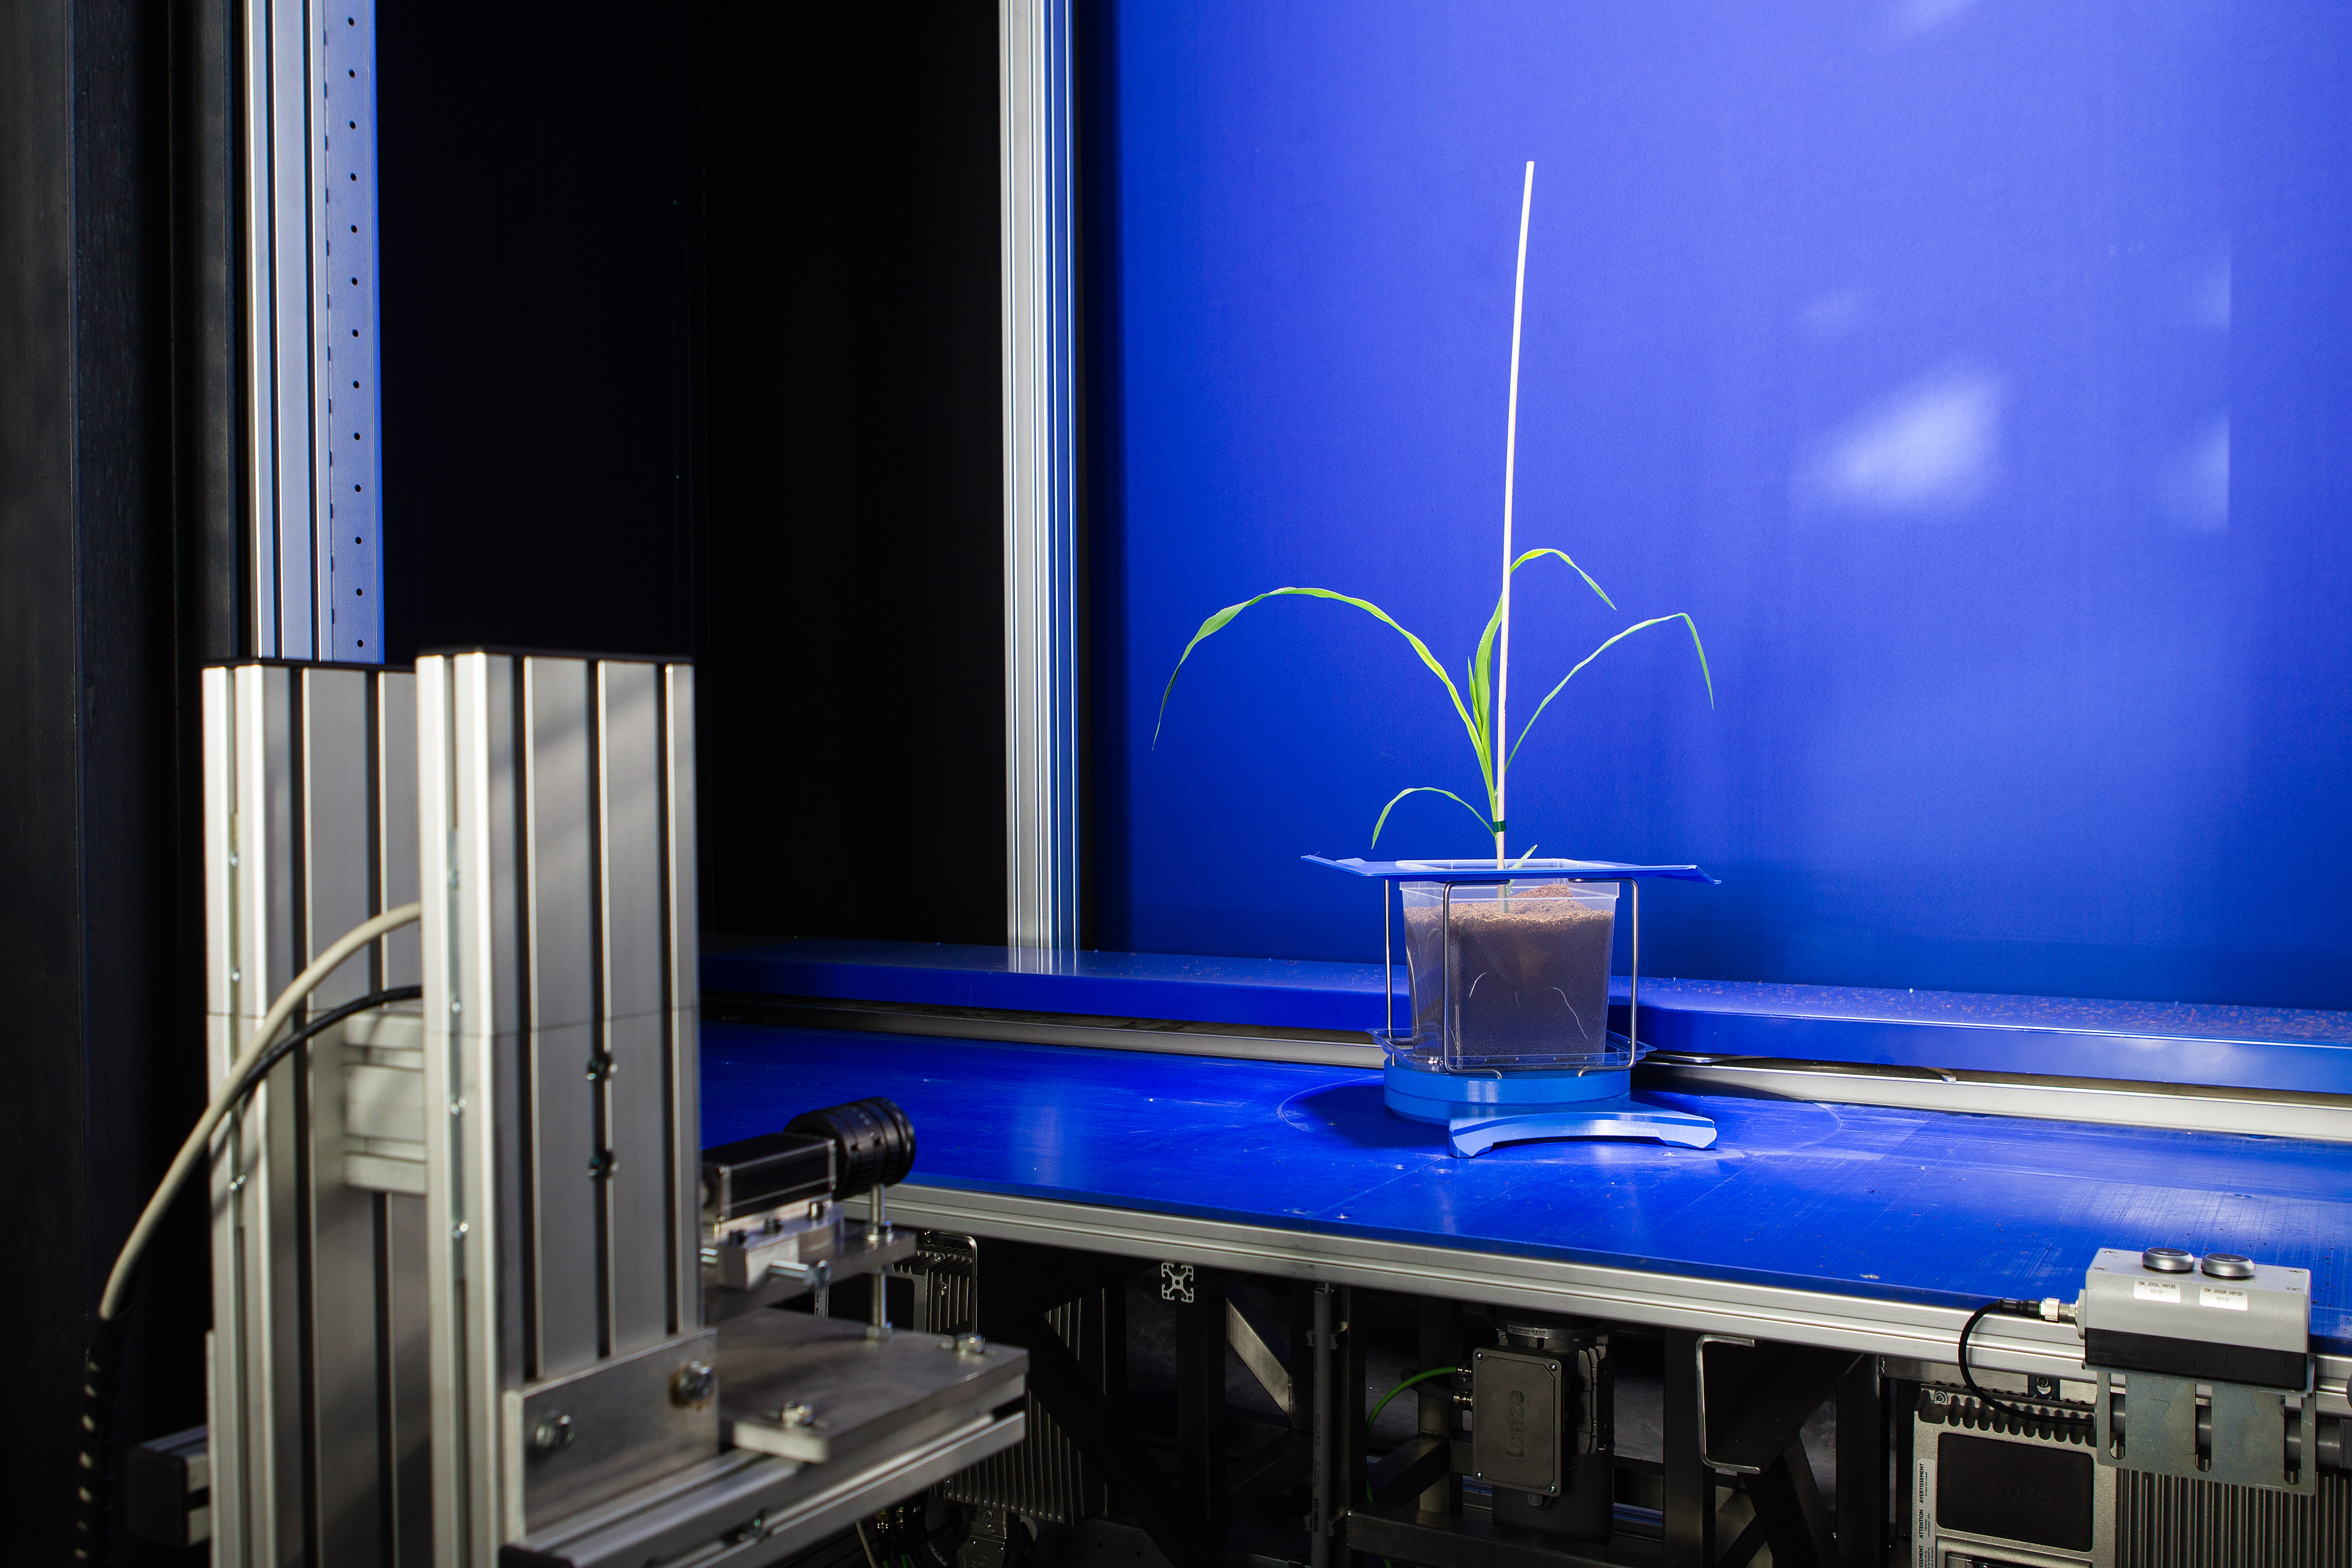
2. Large growth area
The large growth area is the buffer where plants are stored in between imaging. Therefore, the area functions both as growing area and storage. These growth areas are highly adaptable, giving flexibility in plants and used space.
For more information, click here.
Do you want to know more about the digital phenotyping system? Download the explanation of the digital phenotyping system as PDF! We give you the possibility to apply the knowledge on your business and to share the knowlegde with your colleagues by downloading this information in a PDF document.
Download PDF
.png?height=175&name=Website%20header%20+%20uitgelichte%20afbeelding%20(2).png)